
Top 120 container throughput of global ports in 2018
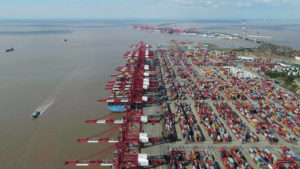
Recently, the Industry Authoritative Analysis Organization Alphaliner released the top 120 container throughput of global ports in 2018. Top 10 ports in China are shortlisted in Global ports ranking top20 in 2018, and SHANGHAI PORT ranks first in the world with a container throughput of 42.01 million TEU. We have provided fenders for the construction and maintenance of many of these ports.
| Rank | Port | 2018 mTEU | Growth |
| 1 | Shanghai | 42.01 | 0.044 |
| 2 | Singapore | 36.6 | 0.087 |
| 3 | Ningbo | 26.35 | 0.071 |
| 4 | Shenzhen | 25.74 | 0.021 |
| 5 | Guangzhou | 21.87 | 0.074 |
| 6 | Busan | 21.66 | 0.057 |
| 7 | Hong Kong | 19.6 | ‐5.7% |
| 8 | Qingdao | 19.32 | 0.055 |
| 9 | Los Angeles/LongBeach | 17.55 | 0.039 |
| 10 | Tianjin | 16.01 | 0.062 |
| View All Rank | |||
SHANGHAI PORT ranks first:
The container throughput of SHANGHAI PORT reached 42.01 million TEU in 2018, a speed increase of 4.4%, container throughput hit a new high, but growth has slowed from last year’s strong 8.4 % growth, the main reason is domestic trade box growth dropped significantly.
From January to November 2017, the growth rate of SHANGHAI’s domestic trade box was 16.7%, while that in 2018 was only 3.4%, and the growth rate of foreign trade boxes remained stable. Due to the large container throughput base of SHANGHAI PORT, coupled with the limited resources of the container terminal coastline, the ports are basically running at high load. In the future, the overall growth rate of containers in SHANGHAI PORT will slow down, but it will further increase the volume of international transshipment containers.
NINGBO ZHOUSHAN PORT breaks into the top there in the world:
The container throughput of NINGBO ZHOUSHAN PORT reached 26.35 million TEU in 2018, a speed increase of 7%, and NINGBO ZHOUSHAN PORT surpassed SHENZHEN PORT by a slight advantage. Mainly benefited from NINGBO ZHOUSHAN PORT’s rapid growth in the foreign trade business. From January to November 2018, NINGBO ZHOUSHAN PORT completed 216.36million TEU in foreign trade boxes, an increase of 8.2% year-on-year, and the growth rate was strong. In addition, NINGBO ZHOUSHAN PORT has strengthened business cooperation with major shipping alliances in route layout, hinterland development and other aspects. It’s helpful for business growth. By the end of 2018, NINGBO ZHOUSHAN PORT has 246 routes of various types.
Pearl River Delta region port ranking comprehensive adjustment:
In the past, Hong Kong port as the most important transit station for goods transportation in the pearl river delta region, such as mature docks, numerous flights and trunk routes. Most goods from the hinterland of China are transferred to the Hong Kong port.
However, in recent years, the gradual rise of SHENZHEN Port and GUANGZHOU Port, which are closer to the inland economic hinterland and have a better connection, is weakening the role of Hong Kong port as a Marine transit station and bringing adverse impact on its container throughput growth.
The container throughput of Hong Kong PORT reached 19.60 million TEU in 2018. It fell 5.7% year-on-year, dropping two places from fifth to seventh.
The GUANGZHOU Port ranking surpassed BUSAN Port and Hong Kong Port in one fell swoop, rising to fifth, mainly due to the strong growth of domestic trade containers. In January-November 2018, the growth rate of domestic trade containers reached 12.627 million TEU, an increase of 9.4 % year-on-year.
In addition, SHENZHEN Port’s growth rate has slightly declined compared with that in 2017, mainly due to the 3.67% drop in domestic trade throughput. Compared with SHENZHEN Port, GUANGZHOU Port is closer to the inland economic hinterland, which has exerted a certain impact on the development of Shenzhen’s domestic trade containers.
TIANJIN Port container throughput increased significantly:
The container throughput of TIANJIN PORT reached 16.01 million TEU in 2018. The growth was 6.2%year-on-year, a marked increase from 3.9% in 2017. This is mainly due to the steady growth of railway coal volume, sea rail combined traffic volume, and land bridge transit volume.
Ranking of other Chinese ports, XIAMEN Port(15th), DALIAN Port(17th), YINGKOU Port(24th), SUZHOU Port(25th), LIANYUNGANG(35th), RIZHAO Port(41st), FOSHANPort(42nd), DONGGUAN Port(46th), FUZHOU Port(51st), NANJING Port( 53Rd), YANTAI Port(60th), TANGSHAN Port(61st), Beibu Gulf Port(67th), QUANZHOU Port(75th), ZHUHAI Port(82nd), HAIKOU Port(92nd), JIAXING Port(97th), JINZHOU Port(104th), WUHAN Port(108th), ZHONGSHAN Port(115th). Taiwan, China, Kaohsiung Port(16th), Taichung(96th), Taipei(102nd), Keelung(113th).
Global container growth slowed in 2018, but ports bucked the trend, with the port of Singapore, the world’s second-largest, growing 8.7 percent. The highest growth rate of containers in 2018 was at the port of Buenaventura in Colombia, with an annual growth rate of 48.8 percent. King Abdullah Port, ranked 83rd, grew 35.29 percent. The port of RIZHAO, ranked 41st in China, had a growth rate of 24.2% last year, and the annual growth rate of container handling in BEIBU bay port was even higher at 26.3%, shining like a national port.
Global container throughput is generally growing, but there are also many ports that have negative growth. Baerboyagang of Panama-29.3 %, Abas Port of Iran-22.4 %, Jorge Fakan Port-13.8 %, Hamburg Port, Germany-1.0 %, China Port, except for Hong Kong-5.7 % negative growth.
Container throughput at ports in Latin America grew 7.7%year-on-year. The top 10 ports in the region are Colon port in Panama, Santos port in Brazil, Mansanayo port in Mexico, Cartagena port in Colombia, Panama Pacific port in Panama, Cayao port in Peru, Guayaquil port in Ecuador, Kingston port in Jamaica, Buenos Aires port in Argentina and San Antonio port in Chile. The container throughput of Guayaquil port reached 2.064 million TEU, up 10.3% year-on-year, making it the seventh-largest port in Latin America.
| Rank | Port | 2018 mTEU | Growth |
| 1 | Shanghai | 42.01 | 4.40% |
| 2 | Singapore | 36.6 | 8.70% |
| 3 | Ningbo | 26.35 | 7.10% |
| 4 | Shenzhen | 25.74 | 2.10% |
| 5 | Guangzhou | 21.87 | 7.40% |
| 6 | Busan | 21.66 | 5.70% |
| 7 | Hong Kong | 19.6 | ‐5.7% |
| 8 | Qingdao | 19.32 | 5.50% |
| 9 | Los Angeles/Long Beach | 17.55 | 3.90% |
| 10 | Tianjin | 16.01 | 6.20% |
| 11 | Dubai | 14.95 | ‐2.7% |
| 12 | Rotterdam | 14.51 | 5.70% |
| 13 | Port Klang | 12.32 | 2.80% |
| 14 | Antwerp | 11.1 | 6.20% |
| 15 | Xiamen | 10.7 | 3.10% |
| 16 | Kaohsiung | 10.45 | 1.70% |
| 17 | Dalian | 9.77 | 0.60% |
| 18 | TanjungPelepas | 8.96 | 7.00% |
| 19 | Hamburg | 8.77 | ‐1.0% |
| 20 | LaemChabang | 8.07 | 3.70% |
| 21 | New York/New Jersey | 7.18 | 7.00% |
| 22 | Colombo | 7.05 | 13.50% |
| 23 | Jakarta | 6.9 | 13.50% |
| 24 | Yingkou | 6.49 | 3.30% |
| 25 | Suzhou | 6.36 | 8.20% |
| 26 | Ho Chi Minh City | 6.33 | 6.80% |
| 27 | Bremerhaven | 5.48 | ‐0.6% |
| 28 | Valencia | 5.18 | 7.30% |
| 29 | Tokyo | 5.11 | 1.10% |
| 30 | Manila | 5.05 | 4.70% |
| 31 | NhavaSheva | 5.05 | 7.20% |
| 32 | Piraeus | 4.91 | 18.40% |
| 33 | Algeciras | 4.77 | 8.70% |
| 34 | Haiphong | 4.76 | 5.80% |
| 35 | Lianyungang | 4.75 | 0.70% |
| 36 | Mundra | 4.44 | 4.80% |
| 37 | Savannah | 4.35 | 7.60% |
| 38 | Colon | 4.32 | 11.10% |
| 39 | Santos | 4.12 | 7.00% |
| 40 | Jeddah | 4.12 | ‐0.9% |
| 41 | Rizhao | 4 | 24.20% |
| 42 | Foshan | 4 | 2.50% |
| 43 | Surabaya | 3.87 | 8.50% |
| 44 | Felixstowe | 3.8 | ‐8.7% |
| 45 | Seattle /Tacoma | 3.8 | 2.60% |
| 46 | Dongguan | 3.5 | ‐10.5% |
| 47 | Barcelona | 3.47 | 16.80% |
| 48 | Tangier Med | 3.47 | 4.80% |
| 49 | Vancouver(BC) | 3.4 | 4.40% |
| 50 | Salalah | 3.39 | ‐14.2% |
| 51 | Fuzhou | 3.34 | 11.00% |
| 52 | Marsaxlokk | 3.31 | 5.10% |
| 53 | Nanjing | 3.23 | 2.50% |
| 54 | Ambarli | 3.17 | 1.50% |
| 55 | Incheon | 3.11 | 1.90% |
| 56 | Manzanillo | 3.08 | 8.80% |
| 57 | Port Said | 3.05 | 2.80% |
| 58 | Yokohama | 3.03 | 3.80% |
| 59 | Melbourne | 3.01 | 7.40% |
| 60 | Yantai | 3 | 11.10% |
| 61 | Tangshan | 2.96 | 16.90% |
| 62 | Durban | 2.96 | 9.50% |
| 63 | CaiMep | 2.95 | 20.80% |
| 64 | Kobe | 2.94 | 0.70% |
| 65 | Chittagong | 2.9 | 8.90% |
| 66 | Le Havre | 2.88 | 0.90% |
| 67 | Guangxi Beibu | 2.88 | 26.30% |
| 68 | Nagoya | 2.88 | 3.30% |
| 69 | Cartagena | 2.86 | 6.90% |
| 70 | Norfolk | 2.86 | 0.50% |
| 71 | Houston | 2.7 | 9.80% |
| 72 | Sydney | 2.65 | 4.70% |
| 73 | Genoa | 2.61 | ‐0.5% |
| 74 | Oakland | 2.55 | 5.20% |
| 75 | Quanzhou | 2.4 | 7.20% |
| 76 | Kwangyang | 2.4 | 7.50% |
| 77 | Osaka | 2.4 | 3.40% |
| 78 | Karachi | 2.35 | 5.70% |
| 79 | Callao | 2.34 | 4.00% |
| 80 | GioiaTauro | 2.33 | 2.45 |
| 81 | Charleston | 2.32 | 6.40% |
| 82 | Zhuhai | 2.31 | 1.60% |
| 83 | King Abdullah | 2.3 | 35.29% |
| 84 | St Petersburg | 2.13 | 10.90% |
| 85 | Bangkok | 2.08 | 6.70% |
| 86 | Guayaquil | 2.06 | 10.30% |
| 87 | Balboa | 2.05 | ‐29.3% |
| 88 | Bandar Abbas | 2.02 | ‐22.4% |
| 89 | KhorFakkan | 2 | ‐13.8% |
| 90 | Southampton | 1.97 | ‐1.5% |
| 91 | Gdansk | 1.95 | 23.30% |
| 92 | Haikou | 1.85 | 12.90% |
| 93 | Kingston | 1.83 | 9.00% |
| 94 | Buenos Aires | 1.8 | 22.40% |
| 95 | Sines | 1.75 | 4.90% |
| 96 | Taichung | 1.74 | 5.00% |
| 97 | Jiaxing | 1.72 | 19.40% |
| 98 | London | 1.7 | 23.20% |
| 99 | Montreal | 1.68 | 9.20% |
| 100 | Mersin | 1.66 | 7.00% |
| 101 | San Antonio | 1.66 | 28.10% |
| 102 | Taipei | 1.66 | 6.30% |
| 103 | Khalifa Port | 1.64 | 17.00% |
| 104 | Jinzhou | 1.62 | 33.20% |
| 105 | Chennai | 1.61 | 4.10% |
| 106 | Zeebrugge | 1.6 | 5.20% |
| 107 | Izmit | 1.6 | 21.40% |
| 108 | Wuhan | 1.57 | 15.80% |
| 109 | Dammam Saudi | 1.54 | ‐2.6% |
| 110 | Penang | 1.51 | 0.20% |
| 111 | La Spezia | 1.49 | 0.80% |
| 112 | Ashdod | 1.48 | ‐3.2% |
| 113 | Keelung | 1.47 | 3.80% |
| 114 | Haifa | 1.47 | 9.40% |
| 115 | Zhongshan | 1.44 | 0.00% |
| 116 | San Juan | 1.41 | 6.50% |
| 117 | Brisbane | 1.38 | 7.20% |
| 118 | Fos Marseille | 1.38 | 1.10% |
| 119 | Buenaventura | 1.37 | 48.80% |
| 120 | Lome | 1.36 | 13.80% |